
Asymmetrical Fission Products
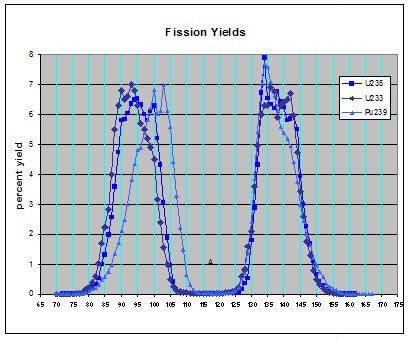
One of the most interesting and intriguing problems regarding nuclear physics is the fission of heavy elements into asymmetrical daughter products. The first figure represents the number of daughter products produced and is shown using a logarithmic scale. The second figure shows the same data using a linear scale.
The Anomalies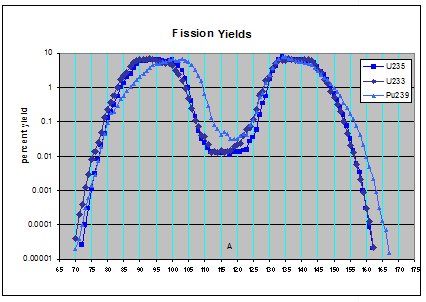
- When heavy nuclei under go spontaneous-fission, the production of daughter products is not symmetrical, which under regular circumstances would be expected to occur.
- Regardless of the heavy nuclei that under go fission, the fundamental distribution of isotopes in the heavy fraction of daughter products is essentially the same.
Standard Observations
There are several conclusions that can be drawn from heavy element
nuclear fission.
- The lower boundary for spontaneous fissions appears to be at Radium with 226 nucleons, but more commonly the lower boundary is considered to be thorium 230.
- Nuclei heavier than thorium are more prone to under go fission as their nuclear mass increases.
- The mass of the heavier fraction of daughter products centers around an A of 136 regardless of the mass of the nuclei under going fission. The center of the upper lob is basically the same regard less of the original mass of the element undergoing fission.
- The heavier the nuclei under going a fission the more massive the center of the lighter daughter products becomes. The center of the lower mass lob increases in direct proportion to the mass of the fissionable elements.
- There must be a basic or fundamental aspect about the nuclear structure that is coincident with the mass represented by the upper lob or heavier daughter products with a mass of about A = 134 to 144 for an average of A = 139 or 140.
Our Observations
When the weak
layers are offset from the center of the nuclei, the nucleus will
break on those weakened planes. That model created a consistent heavy
daughter product centered at about 140. This is because the center
kernel will always be the same size but the end kernels will vary with
the size of the nucleus. See the section on periodic table for the nucleus.
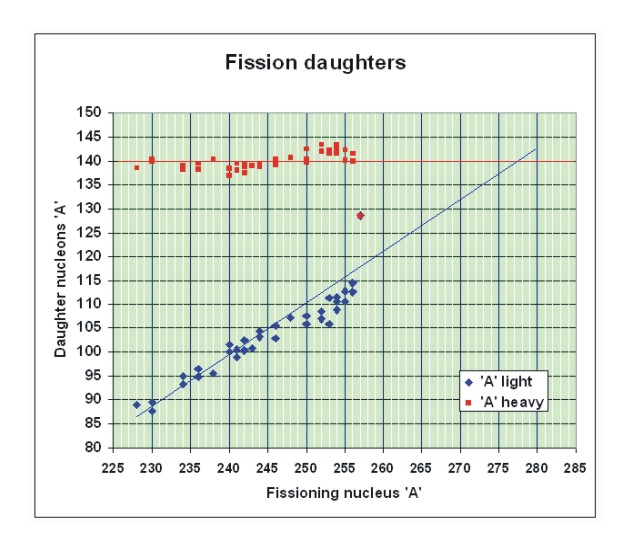
- The table of fission daughter products identifies an interesting aspect of the nuclear fission. First the heavy daughter product is about the same, regardless of the beginning nucleus and second the lighter daughter product trend is to crosses the heavy daughter product when they are both equal. As obvious as that is, it indicates a fundamental stable concentration of nucleons within the nucleus that consists of around 140 nucleons.
- The accompanying trend graph indicates that the trend line for the mass of the lighter daughter product crosses the trend line of the mass of the heavier daughter product when the mass of the two particles are equal. This may seem trivial but it indicates that there is definite structure in the nucleus that is controlling the size of these two daughter products
- Uranium235 readily accepts an additional neutron to become U236. This achieves symmetrical balance of the nucleus.
- This extra neutron starts the lattice structure to oscillate as a standing half-wave. To form a standing half wave the center kernel moves in the opposite direction to the two end kernels.
- The center of the nucleus is between layers 6 & 7 or layer 6.5.

- In the lattice model of the nucleus described in this paper there are bonding weaknesses between layers 3 & 4 and between layers 9 & 10. The nucleus between layers 3 and 10 comprise a stable kernel containing 126 nucleons. For a split of the core nucleons in layers 3 and 10 the number of nucleons is about 138 with a max variance in the models range of about 129 to 147.
- The daughter product of natural fission has a heavy fraction plateau range that lies between about 131 and 145 nucleons with a center of 138 nucleons.
Findings
These bonding differences between layers result from varying number of
protons sites that are filled on each layer. The relative bonding
strengths are shown in the accompanying graph. Both the strong and
electrical bonds show weakness between the same layers. The best way
to understand this relationship is to observe the growth of the
nucleus by the reader building this model along the path of stability
from the beginning.
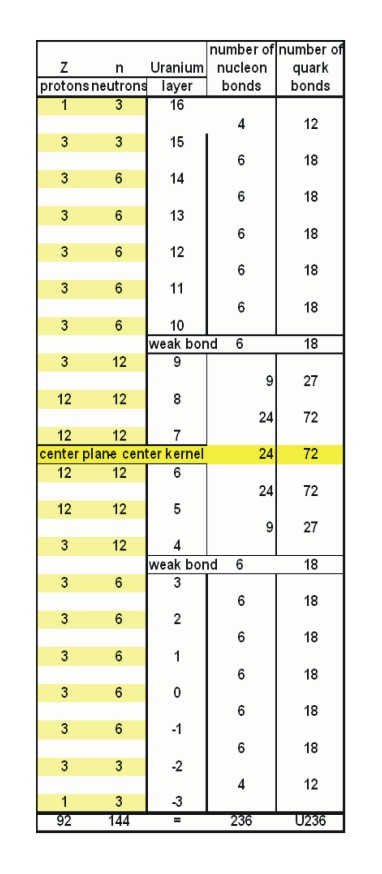
- There are 24 strong bonds and 72 electrical bonds between layers
5&6, layers 6&7 and layers 7&8.
- Layer 5, 6, 7 and 8 each have 24 nucleons.
- There are 9 strong bonds and 27 electrical bonds between layers
4&5 and layer 8 & 9.
- Layers 4 and 9 each have 15 nucleons.
- There are 6 strong bonds and 18 electrical bonds between layer
3&4 and layer 9&10.
- Layers 3 and 10 each have 18 nucleons.
- There are 9 strong bonds and 27 electrical bonds between layer
2&3 and layer 10&11.
- Layers 2 and 11 each have 18 nucleons.
- There are 9 strong bonds and 27 electrical bonds between layer
1&2 and layer 11&12.
- Layers 1 and 12 each have 9 nucleons.
- There are 6 strong bonds and 18 electrical bonds between layer
0&1 and layer 12&13.
- Layers 0 and 13 each have 6 nucleons.
- There are 4 strong bonds and 12 electrical bonds between layer
-1&0 and layer 13&14.
- Layers -1 and 14 each have 4 nucleons.
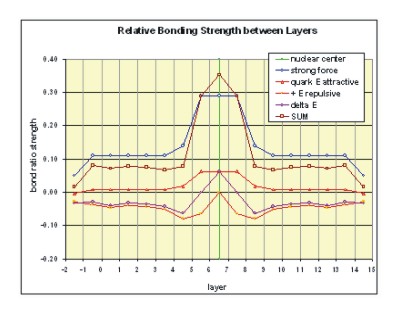
The relative bonding strengths are shown in the accompanying graph. The graph indicates that the weakest bonding occurs between layer layers 3&4 and layers 9&10. Both the strong and electrical bonds show weakness between these layers. The open proton positions starting in layers 4 and 9 resulting from the building positive charge of the nucleus produces the weakness that occurs between layers 3&4 and 9&10.
- Between the two weak bonding layers is the center section of the
nucleus or the “central kernel”. Included in the
central kernel in and between layers 4 through 9, there are
126 nucleons, 54 protons and 72 neutrons for an excess of 18
unpaired neutrons. This central kernel is the same size
regardless of the size of the nucleus under going fission.
- The two weak bonding layers contain 30 nucleons, 6 protons and 24 neutrons, the weak layer has an excess of 18 unpaired neutrons.
The number of nucleons in the center kernel and the two weak
bonding layers never change, however the number of nucleons in the two
end kernels does change.

- For U235 plus the inducing neutron, the end layers above and below the two weak bonding layers contain a total of 74 nucleons, 26 protons and 48 neutrons, the end kernels have an excess of 22 unpaired neutrons.
- For Pu239 plus the inducing neutron, the end layers above and below the two weak bonding layers contain a total of 78 nucleons, 28 protons and 50 neutrons, the end kernels have an excess of 24 unpaired neutrons.
- For Cf251 plus the inducing neutron, the end layers above and below the two weak bonding layers contain a total of 82 nucleons, 32 protons and 58 neutrons, the end kernels have an excess of 26 unpaired neutrons.
This lattice model demonstrates how fissions demonstrates how the lighter daughter product gets heavier while the heavier daughter product remains constant regardless of the nuclei involved. This is precisely what occurs in an actual or real world fission.
Back to U235, if half or 9 of the extra18 neutrons go with the Central Kernel that subdivision will be composed of 135 nucleons. For fusion of U235+1 that leaves the two free neutrons, plus the two End Kernels that fuse to form the lighter daughter which is initially composed of 38 protons and 58 neutrons for a total of 96 nucleons.
- Via rapid negative beta decay the two daughter products derived from the fission of U235 quickly yield two daughter nuclei, one averaging about 135 nucleons, or ranging around barium and xenon and a second grouping around 96 nucleons which is in the neighborhood of molybdenum.
- Fission occurs for U235 when a neutron is captured to form U236. U235 wants the extra neutron to complete radial symmetry within that nucleus. But the energy from the captured neutron starts an oscillation in the U236 nucleus. The central kernel moves in one direction and the two ends move in the other direction. This oscillation forms a standing half wave in the nucleus. The oscillation facilitates the breaking of the 2 weak bonding planes with the central kernel going one way and the two ends kernels going the other.
- The two ends kernels coalesce because they are still close enough to be under the influence of the strong mesonic force. This coalescence results in fusion and the release of energy.
- The energy released during fissions comes primarily from the energy of fusing of the two end kernels. The center kernel is basically stable and thus doesn�t release as much energy. There are 32 protons contained in these two fragments which are two more protons than are contained in the Zn nucleus which represents a complete core and star phase. Beyond this there are an additional 2 protons and 28 neutrons to be assimilated and in some cases altered from neutron to proton to be rearranged and assimilated into the lighter daughter products.
-
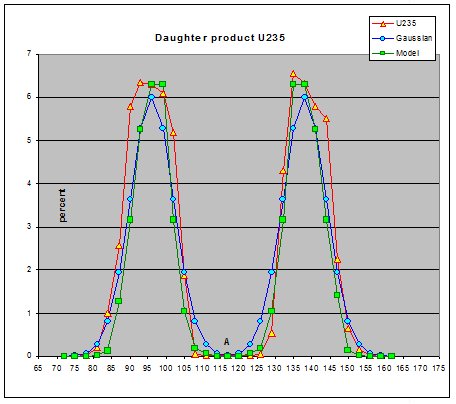 The adjacent graph compares the number of daughter products
produced by the fission of U235 and those predicted by this modified
lattice model. Two algorithms were used to determine the number of
daughter products that might be expected when using this model. The
first is a Gaussian distribution models centered on 96 and 135
nucleons and the second is a probability model based on the number of
available neutrons in the weak bonding layer.
The adjacent graph compares the number of daughter products
produced by the fission of U235 and those predicted by this modified
lattice model. Two algorithms were used to determine the number of
daughter products that might be expected when using this model. The
first is a Gaussian distribution models centered on 96 and 135
nucleons and the second is a probability model based on the number of
available neutrons in the weak bonding layer.
- Agreement between the three curves indicates that some anomalies are probably the result of bonding interaction not accounted for when using a generalized simulation of how the bonds separate along the weak layers.
The next section is a depiction of how fissions occur using these weak bonding layers.
The biggest surprise is that the energy released during the fission process is really fusion energy.